16 - February - 2009
Nifty Daily Chart Analysis (2948)
Nifty EOD chart has formed “White Opening Marubozu” theoretically It may be the first part of a bullish continuation pattern. Friday Nifty has crossed and closed above 55 EMA after 5 Jan 09, which has given some amount of satisfaction for Bulls. Daily RSI and MACD is exhibiting positive divergence where as Stochastic has given Negative cross over in Over sold region which may lead to some amount of profit booking in early part of the day.
Day Trader avoid spike on either side as today is Interim Budget announcement. Capital preservation is more advisable.
Support:- 2935/2916/2875
Resistance:- 2969/2987/3012

09 - February - 2009
Nifty Daily Chart Analysis (2843)
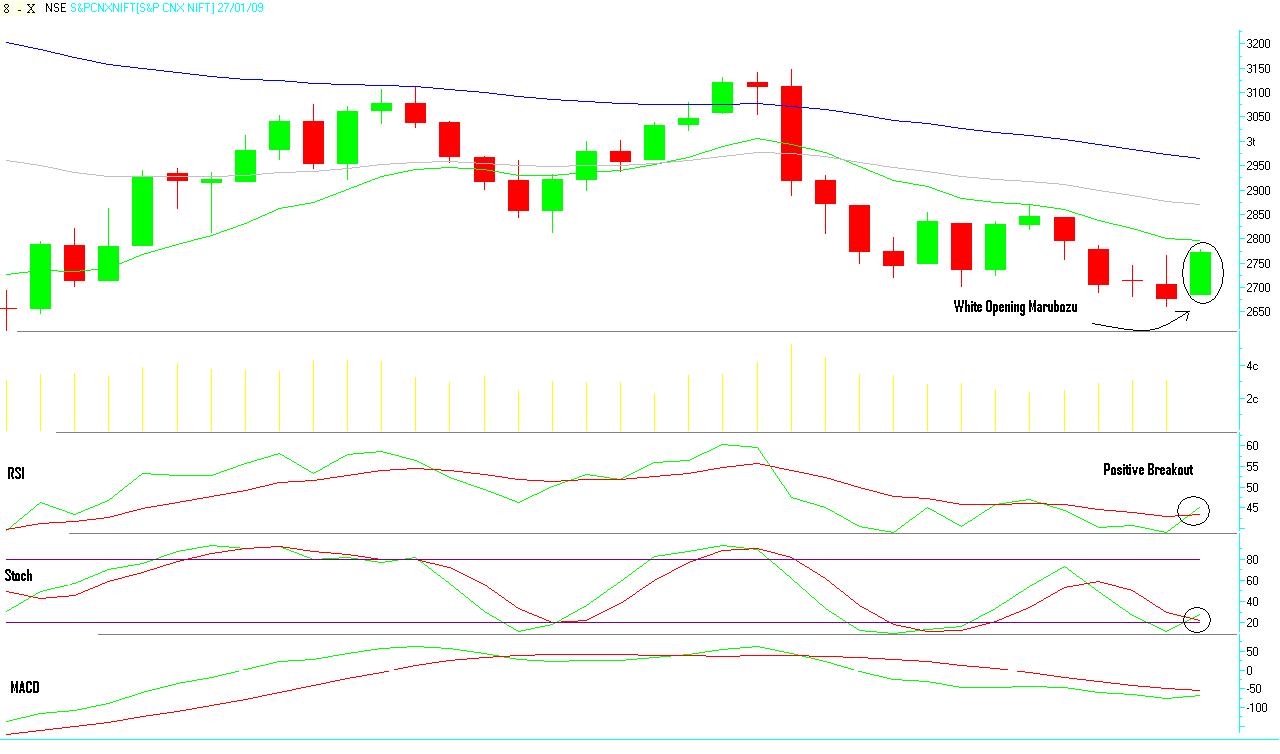
Friday Nifty ended with “White Opening Marubozu” and closed above three days high with strong bullish break out on Daily RSI, Stochastic and MACD. Nifty has formed good support at 2800 level on Trend line. Resistance at 2885/2900/2925. Intra Day trader can trade with positive bias but still avoid spike as Intermediate trend is still bearish unless and until it crosses 3147 on closing basis.

04 - February - 2009
Nifty Daily Chart Analysis (2784)
Yesterday Nifty ended with lot of uncertainty over Bulls and Bears and finally formed “White Spinning Top”. If we talk theoretically then White Spinning Top formed after a long black candlestick, which suggest weakness among the bears and we may see interruption in trend. Daily RSI is in Neutral Region, Stochastic exhibiting negative divergence where as MACD is in Positive region but it is almost flat. 2800 will work as a good Resistance on closing basis for Bull to take charge.
Support:- 2747/2725
Resistance:- 2805/2837/2856

03 - February - 2009
Nifty Daily Chart Analysis (2767)
Finally Nifty unable to hold key moving averages and closed with “Long black candle” and with this Nifty has also broken trend line support of 2800, from here on 2800 will work as a good resistance zone for intra day trader. Daily RSI and Stochastic is giving negative divergence, where as MACD is exhibiting positive divergence. Day trader should play with negative bias.
Support:- 2746/2700
Resistance:- 2800/2819/2847

02 - February - 2009
Nifty Daily Chart Analysis (2849)
EOD chart has formed “Bullish Engulf Pattern” with “Hanging Man Pattern” on Friday. We are stick to same view as we advocated last week, Nifty is bullish above 2869 level on closing basis. Currently Nifty is well above its 13 EMA(2816) and 34 EMA(2867) which suggest there is some amount of Bull steam is left for near term although that doesn’t mean that market is bullish , for intermediate term outlook is still bearish unless and until if closes above 3147. Currently trend line support exist at 2800. Daily RSI and MACD is exhibiting positive divergence where as Stochastic is in over bought region.
Support:- 2841/2827/2815
Resistance:- 2929 /2953

29 - Janaury - 2009
Nifty Daily Chart Analysis (2849)
Yesterday we have seen effect of Candle stick Pattern of "WHITE OPENING MARUBOZU" and we ended with handsome gain of 78 points or 2.82%.
EOD charts has formed "BULLISH THREE OUTSIDE UP" which suggest confirmation of the bullish trend reversal. Currently Nifty is well above its trend line support of 2830 and 13 EMA which is at 2803 and in addition, like wise RSI and Stochastic even finally MACD has also given Bullish signal. One thing I would like to note here is 2869 is two week high, if sustain above this then bull will get more grip on the market. Intra Day trader should trade with positive bias but with minimal stop loss as today is expiry day so we are expecting high volatility in the market.
Support:- 2830/2803/2780 (Major Support)
Resistance:- 2869/2896/2925

28 - Janaury - 2009
Nifty Daily Chart Analysis (2771)
EOD chart has formed ?WHITE OPENING MARUBOZU? and yesterday?s candle has totally engulf previous day?s move. This indicates more probabilities of bullish break out. Daily Oscillators RSI and Stochastic exhibiting positive divergence where as MACD is still in negative territory. 2796 will work as a good level for bull to take charge for intra day. Major Support formed at 2745 level.
Support:- 2745-2733-2716
Resistance:- 2796-2815-2835
27 - January - 2009
Nifty Daily Chart Analysis (2679)
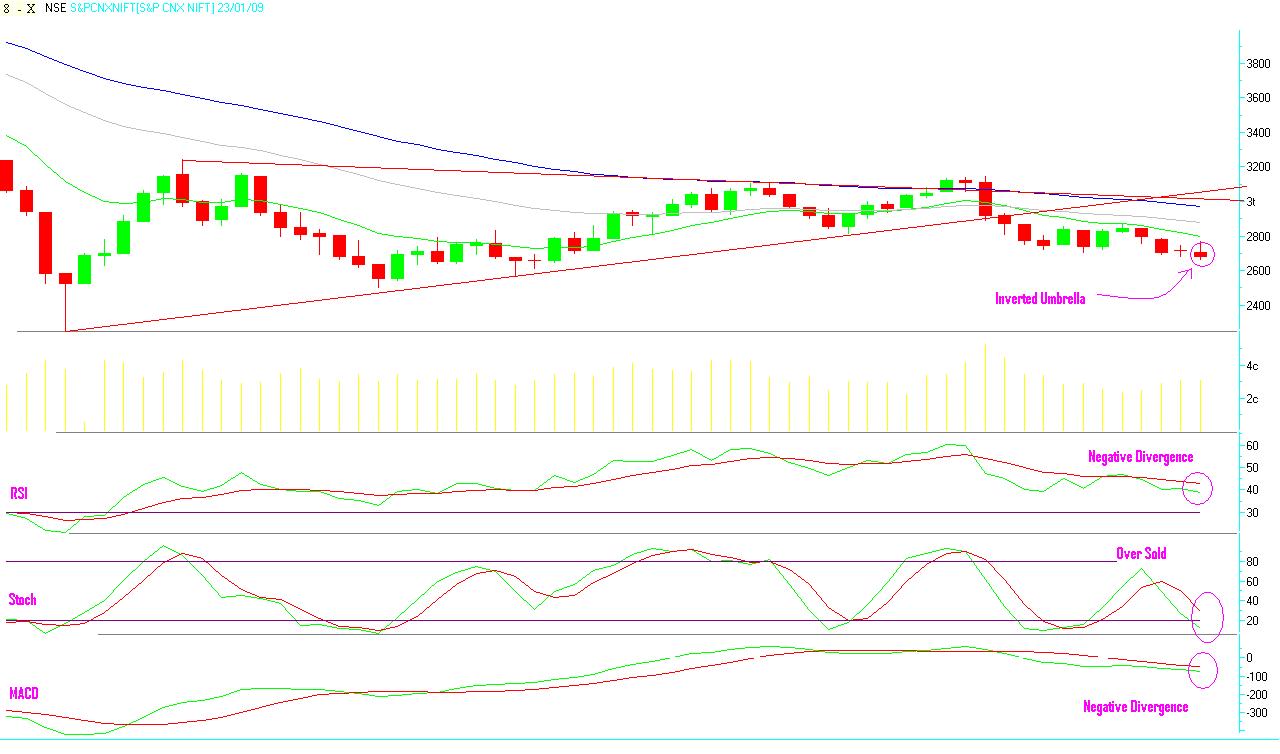
Nifty EOD chart has formed “Inverted Umbrella” which suggest some bounce back but reliability is very deem while looking at current over scenario. Daily RSI and MACD is exhibiting negative divergence and Stochastic is in over sold region which also suggest again some bounce back in early trade. On Moving averages Nifty is well below its 13 EMA (2800) which will worked as a important resistance for near term.
On other side Nifty Daily chart has formed “Symmetrical Triangle Pattern” which has given bearish break out and this will lead the target of 2266/2221/2040 in short term.
Day Trader should apply last week strategy of Short on higher level, will work well at this juncture.
Support:- 2655/2622
Resistance:- 2710/2725/2765/2800(Trend Reversal Resistance)
23 - January - 2009
Nifty (2714)
EOD chart has formed “Doji” pattern which suggest uncertainty in the market. As mentioned yesterday, major support formed at 2645 (closing basis) and after that straight to 2600. As mentioned on 19 January close below 2700 will open the door for 2307/2260/2074 in short term. Stochastic , RSI and MACD exhibiting negative divergence. Trader should use every higher level to short the market.
Support:-2680/2645/2600
Resistance:- 2745/2765
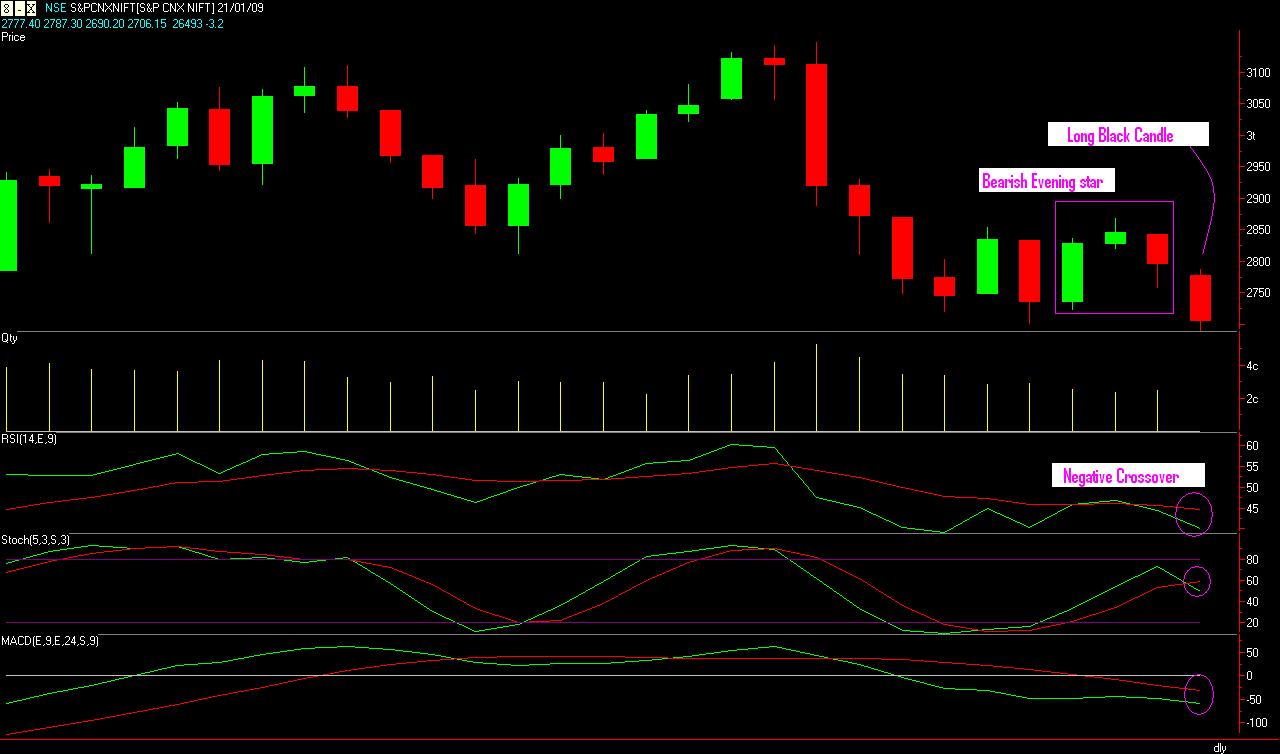
22 - January - 2009
Nifty (2706)
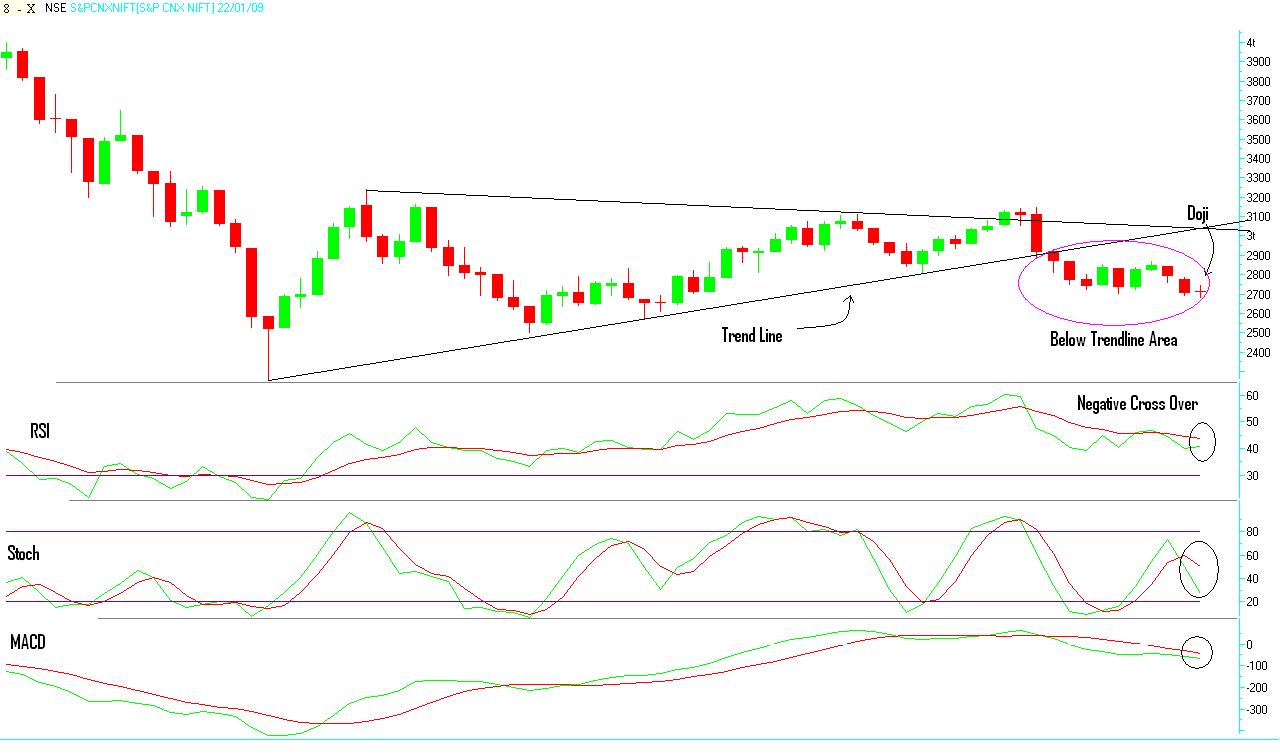
“Evening start pattern “ has played its role and we saw huge round of selling and the day ended with “Long Black Candle” and technically we are below first day’s candle’s low which suggest more depth is left for negative movement from here on. Daily RSI,MACD and Stochastic exhibiting negative divergence. On 30 Min charts there is formation of “double bottom” at 2690 and it is a nine days intraday lowest point, below which only one support exist at 2646 for intra day level. Resistance at 2727/2739/2750.
Support:- 2690/2645
Resistance:- 2727/2739/2750/2775
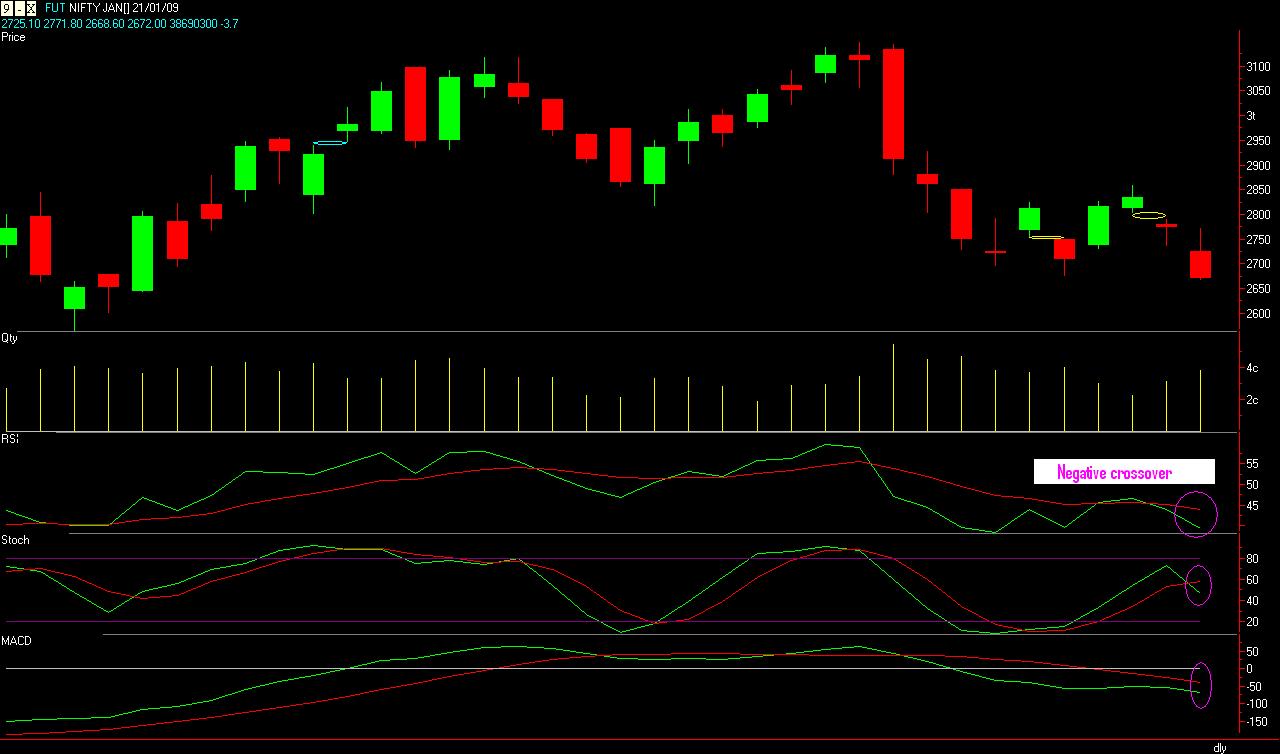
Nifty January Future (2672)
Nifty Future has also formed bearish pattern and support formed at 2643 level and below which only at 2600 level. Daily RSI, MACD and Stochastic exhibiting negative divergence. Important to note here is on 30 Minutes chart, Stochastic and RSI is in over sold region which suggest some amount of bounce back in early trade. Intraday trader should use this opportunity to short at higher level as scenario looks very weak in near term.
Support:- 2643/2600
Resistance:- 2708/2721/2733
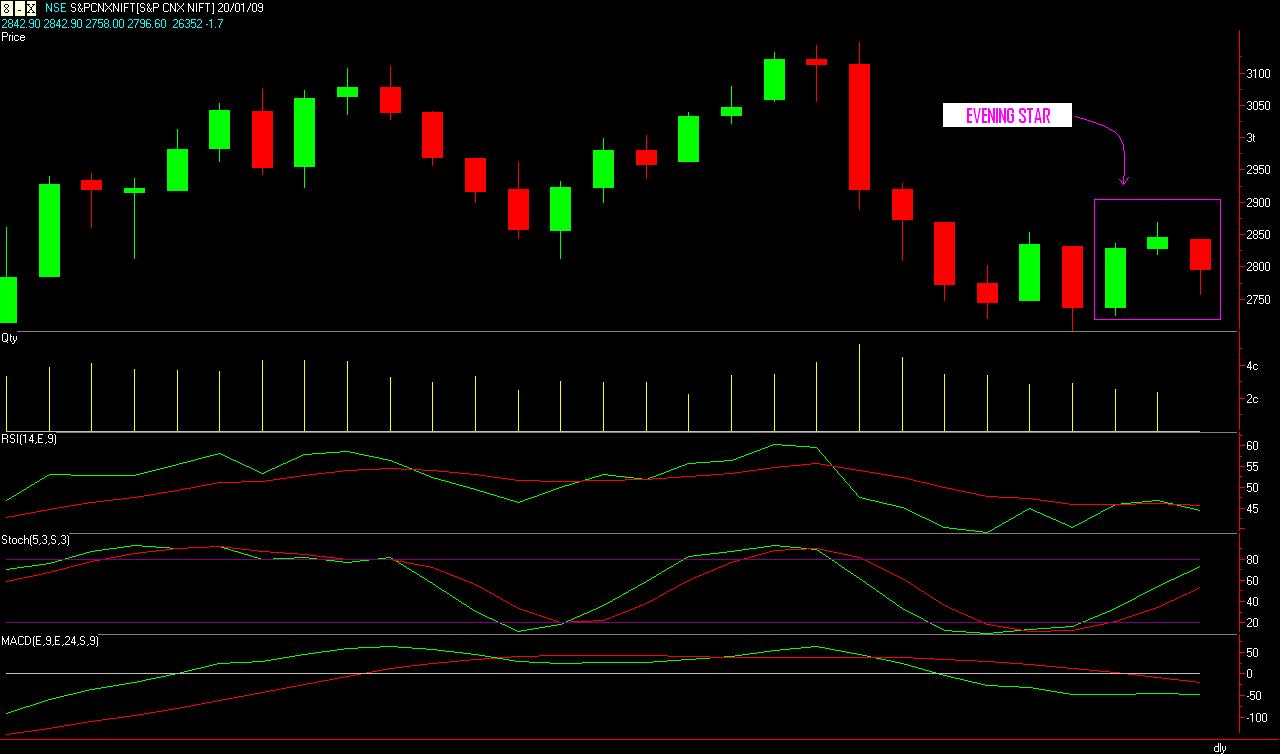
Nifty (2797)
EOD chart has formed “EVENING STAR” Pattern which suggest bearish trend to continue. RSI and MACD is exhibiting negative divergence where as Stochastic is almost near to over sold region. Major Resistance at 2811/2834/2860 level and Major support at 2765-2757-2725 level.
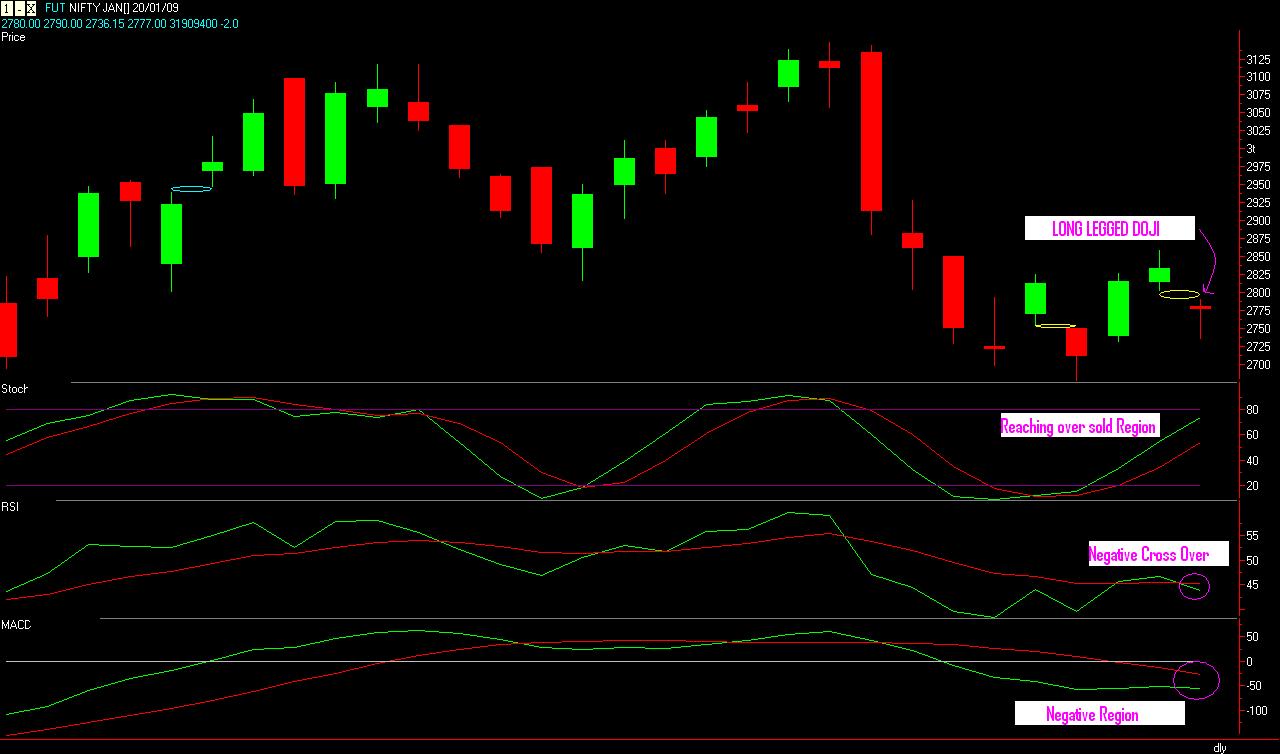
Nifty January Future (2777)
EOD chart has formed “LONG LEGGED DOJI” which suggest there is a great amount of indecision in the market. This pattern occurred after two days of up move so this will give more weight age on down side movement. Major Resistance at 2790/2825/2845 level and Major support at 2743-2710-2695 level.